Blog Opinion
Why streaks make you quit, and what to track instead
Streaks help while they last and work against you once they break. Across 7 studies, people whose log showed a broken streak were less likely to keep going than people whose log showed an intact one, even when both had done exactly the same thing. A completion rate is the fairer score: it keeps the credit for every day you showed up, so a missed Tuesday costs a few points instead of the whole record.
Day 90, back to zero
A streak counter stores a single fact: how many days in a row. Walk every day for 89 days, miss the 90th because the flight left at 6am, and the counter reads 0. You walked on 89 of the last 90 days, and the counter has no way to say so.
The zero matters because of what people do after they see it. The consumer researchers Jackie Silverman and Alixandra Barasch tested this directly. In a 30-day step challenge run for 980 university employees, people were more likely to reach the day’s 7,000 steps while their app showed a streak running than on the day after one broke. Field data can’t rule out that the people with intact streaks were simply keener, so the researchers moved to the lab and held behaviour constant. There, 601 online participants did the same 4 strength exercises, the kind meant for a desk or a sofa. For half of them, the app reported that its log hadn’t loaded properly and showed an X in place of the 4th check. Offered another strength exercise or a stretch, 66% of the intact group chose to carry on, against 58% of the group with the X. Everyone had done the same 4 exercises. Only the record was different.
In later studies, the gap grew when people blamed themselves for the break and shrank when they were allowed to repair it. The authors’ explanation is that keeping a logged streak becomes a goal in its own right. Read the other way round, a broken streak is a goal that has just been taken away.
Why one slip turns into stopping
Addiction researchers knew this shape decades before habit apps. In their model of relapse, Marlatt and Gordon described what they called the abstinence violation effect: the reaction to a first slip after a period of abstinence. People who read the slip as proof of a flaw in themselves tend to feel guilt, and people who explain it with something fixed and global (“I have no willpower”) are more likely to give up the attempt entirely than people who put it down to one situation they didn’t yet know how to handle. Relapse prevention separates a lapse, one slip, from a relapse, the return to the old pattern. Part of keeping the first from becoming the second is treating a lapse as an error to learn from rather than evidence of weak willpower.
Dieting research found the same pattern. In 1975, C. Peter Herman and Deborah Mack gave people nothing, 1 milkshake or 2 before an ice-cream “taste test”. Unrestrained eaters ate about 47% less ice cream after the milkshakes, which is what being full predicts. Restrained eaters, people who habitually hold back on food, ate about 66% more. Herman and Janet Polivy, who have studied restrained eating together for more than 40 years, called this the “what the hell effect”, as if the dieter were saying “what the hell, my diet is already broken so I might as well eat and enjoy for now.” By their own account, they named it in a 1980 book chapter, 5 years after the milkshakes.
None of this was about habit trackers. The abstinence violation effect comes from drinking, and the milkshake study from a lab and a restraint questionnaire that researchers have argued over ever since. Silverman and Barasch mostly studied streaks 3 actions long, checked lengths up to 20, and say plainly that they can’t speak to much longer ones, such as 100. So day 90 is an extrapolation. What the three lines of research share is the shape of the rule. When the only scores are “intact” and “broken”, one slip moves you from the first to the second, and the second is a hard place to restart from.
Is it okay to miss a day of a habit?
Yes. In the best-known study of habits formed in daily life, Phillippa Lally and colleagues followed volunteers as they built one new daily behaviour, and reported that “missing one opportunity to perform the behaviour did not materially affect the habit formation process.” The same paper found that the more consistently people performed the behaviour, the better their scores fitted the researchers’ habit curve, so the days you do still add up. A single gap doesn’t undo them. (How long the whole process takes is a separate question, with a less tidy answer than 21 days.)
So score the days, not the run. A completion rate is the days you did it divided by the days you meant to, and it keeps everything a streak throws away. Take a month of daily walks with one missed day, the 15th. The streak reads 14, drops to 0, and climbs back to 15 by the 30th. The rate reads 100% for 2 weeks, dips to 93% on the 15th, and ends the month at 97%. Same 29 walks. Only the rate says you mostly walked.
Scale it up and the difference gets starker. Here is a worked illustration, with made-up numbers rather than data. One person walks 14 days out of 14: a perfect streak, and a rate of 100%. Another walks 292 days out of 365: a rate of 80%, and a streak counter that has gone back to zero again and again. The streak ranks the first person higher. The second walked 278 more times.
What to do after breaking a streak
Do the next one, today if you can. A rate starts recovering on the first day you’re back, and nothing about the missed day needs fixing or paying back. A habit picked up after a bad fortnight is still the same habit, for the same reason that late is not a failure state.
Then give the miss its real cause. The flight, the sick child, the week a project went sideways: those are situations, and situations can be planned around. That’s the reframe relapse prevention teaches, and it fits what Silverman and Barasch found, that a break hurt more when people blamed themselves for it. If the counter still stings, look at the month instead. A month with 29 walks out of 30 is a good month.
Should a habit last forever?
A streak counter assumes it should. Silverman and Barasch point out that a streak has no end state, since streaks “can only be maintained, not ‘completed’”. So the only way a streak ever ends is the bad way.
Plenty of good habits are meant to stop. Physio ends when the knee heals. A savings sprint ends when you reach the amount. A course of anything is a course because it ends. A tracker built for forever can’t tell those endings from giving up, so the day you finish looks exactly like the day you quit: the same empty box, the same flat line.
A bounded habit has what forever can’t offer, a finish line you can actually cross. Stretch every evening for 30 days. Be in bed by 11pm for 8 weeks. When the end date arrives, the habit is done, in the same sense a task is done, and you can decide with a clear head whether it earns another season. Some of the best things you’ll ever do, you’ll do for exactly 6 weeks.
What to do with tasks you’ll never do
Lists have the same flaw in a different place. Most lists know one ending, done, and everything that ends any other way just stays open. The dinner that got cancelled. The concert that sold out before you got round to it. The present someone else already bought. None of them will ever be done, so they sit there, and anything that sits on a list long enough starts to read as something you didn’t do.
That’s how old lists turn into sediment: layers of things nobody ever got to call “no longer needed”. Opening one means reading all of them again.
A list needs more exits, and 4 cover almost everything:
- Done. You did it.
- Not needed. It stopped mattering, or someone else did it.
- Too late. The window passed, and doing it now would be pointless.
- Cancelled. The plan it belonged to went away.
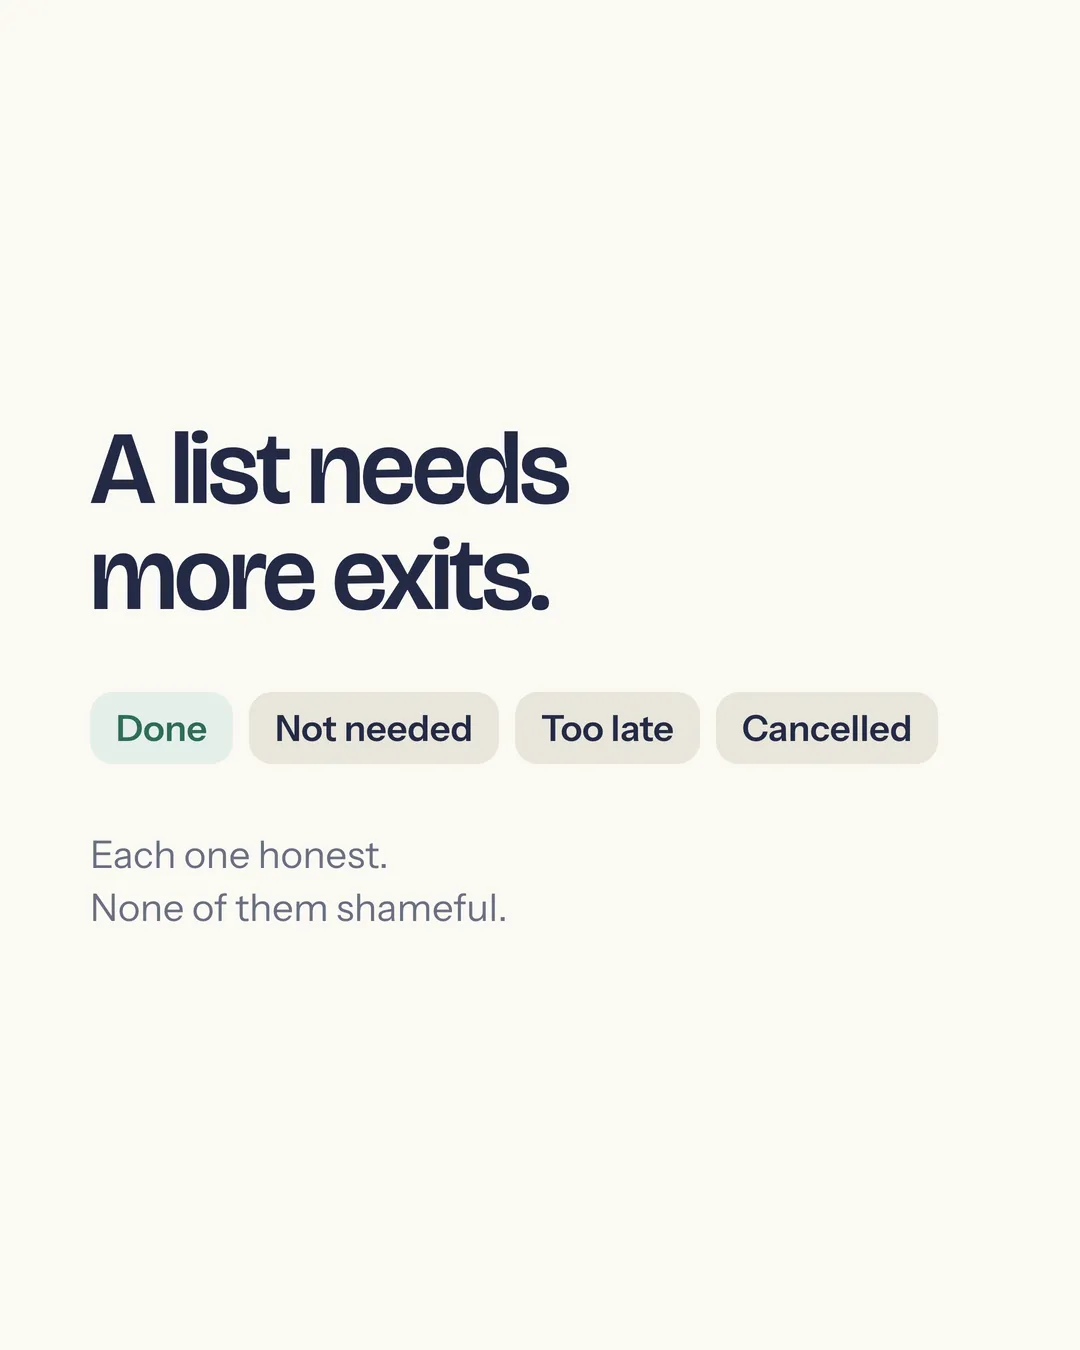
Closing a task without doing it isn’t quitting. It’s bookkeeping, and it leaves the list describing what you still intend to do, which was its only job.
Watch for the items that come back every week, too: watering the plants, reviewing the budget, calling home. Each one gets rescheduled, then rescheduled again, because it was filed as something to finish. That weekly task is a habit in a costume, and it deserves a rate rather than a checkbox.
Why your old trackers died
You may have a small graveyard of systems behind you. The habit tracker that survived 12 days and couldn’t forgive one missed Tuesday. The bullet journal, beautiful and blank since week 3. The spreadsheet with conditional formatting, macros and 3 rows of data.
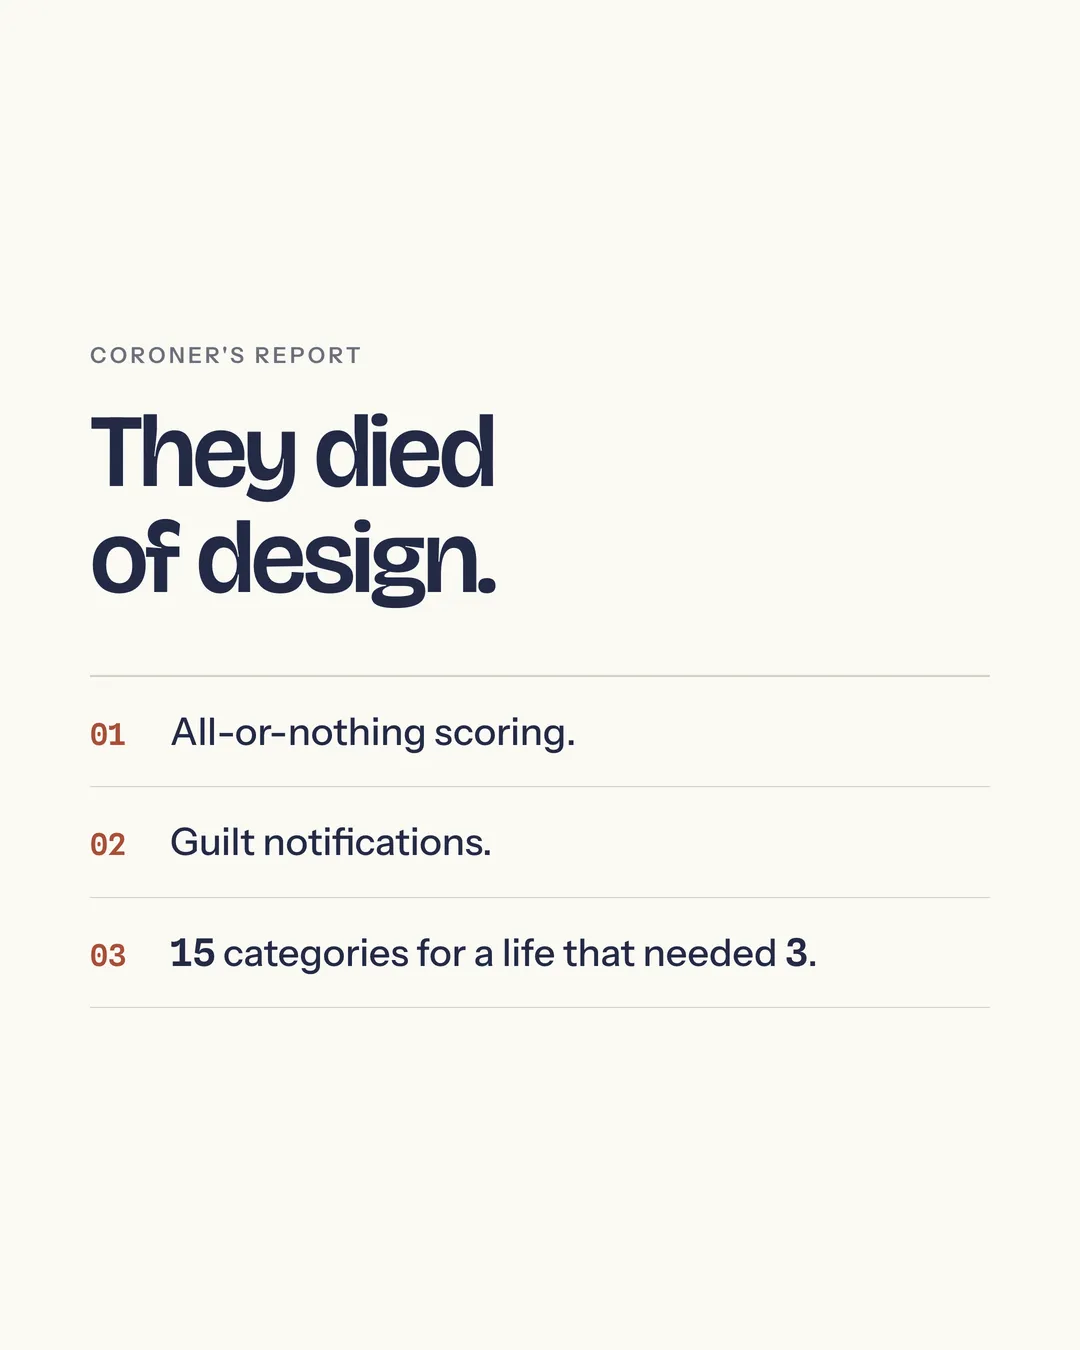
It’s tempting to read that as a verdict on you. Look at what they had in common instead: all-or-nothing scoring, guilt notifications, and 15 categories for a life that needed 3. They died of design. A tool’s job is to absorb your bad weeks, and these kept them on file as evidence.
The same thing happens to lists. Past a certain point you stop avoiding the work and start avoiding the list, because it has become a ledger of everything unresolved, and nobody opens that voluntarily. What helps is an amnesty. Close what’s dead, with whichever honest ending fits. Shrink what’s bloated: 15 categories back to 3, “sort out finances” down to the one step you’d actually take. A list should be safe to open.
On paper or in any app
None of this needs a particular tool. Try 3 things:
- Shade a rate instead of counting a run. On a paper calendar, shade each day you did the thing and leave the others blank. At the end of the month, count the shaded days and divide by the days you meant to. If an app only offers a streak, see whether it can count by the week; Silverman and Barasch suggest that a longer unit of time lets irregular behaviour still show as intact.
- Give your next habit an end date. Write it down when you start: 30 days, 8 weeks, until the knee is better. When the date comes, call it complete before you decide whether to go again.
- Close 3 things without doing them. Find 3 items on your list that are already dead and give each its honest ending: not needed, too late or cancelled. Then open the list again and notice how it reads.
Sources
- Herman, C. P., & Mack, D. (1975). Restrained and unrestrained eating. Journal of Personality, 43(4), 647–660. https://doi.org/10.1111/j.1467-6494.1975.tb00727.x
- Lally, P., van Jaarsveld, C. H. M., Potts, H. W. W., & Wardle, J. (2010). How are habits formed: Modelling habit formation in the real world. European Journal of Social Psychology, 40(6), 998–1009. https://doi.org/10.1002/ejsp.674
- Larimer, M. E., Palmer, R. S., & Marlatt, G. A. (1999). Relapse prevention: An overview of Marlatt’s cognitive-behavioral model. Alcohol Research & Health, 23(2), 151–160. https://pmc.ncbi.nlm.nih.gov/articles/PMC6760427/
- Lowe, M. R. (2017). Herman and Polivy’s restrained eating model. Ingestive Classics, Society for the Study of Ingestive Behavior. https://www.ssib.org/web/classic17.php
- Marlatt, G. A., & Gordon, J. R. (Eds.) (1985). Relapse prevention: Maintenance strategies in the treatment of addictive behaviors. Guilford Press.
- Polivy, J., & Herman, C. P. (2020). Overeating in restrained and unrestrained eaters. Frontiers in Nutrition, 7, 30. https://doi.org/10.3389/fnut.2020.00030
- Silverman, J., & Barasch, A. (2023). On or off track: How (broken) streaks affect consumer decisions. Journal of Consumer Research, 49(6), 1095–1117. https://doi.org/10.1093/jcr/ucac029